Visualization Agents
VapusData Visualization Agents automatically generate, update, and govern data visuals across systems, continuously and accurately.
Features
Visualization Agents Capabilities
The Accounts Payable workflow is designed around real, day-to-day finance operations, including:
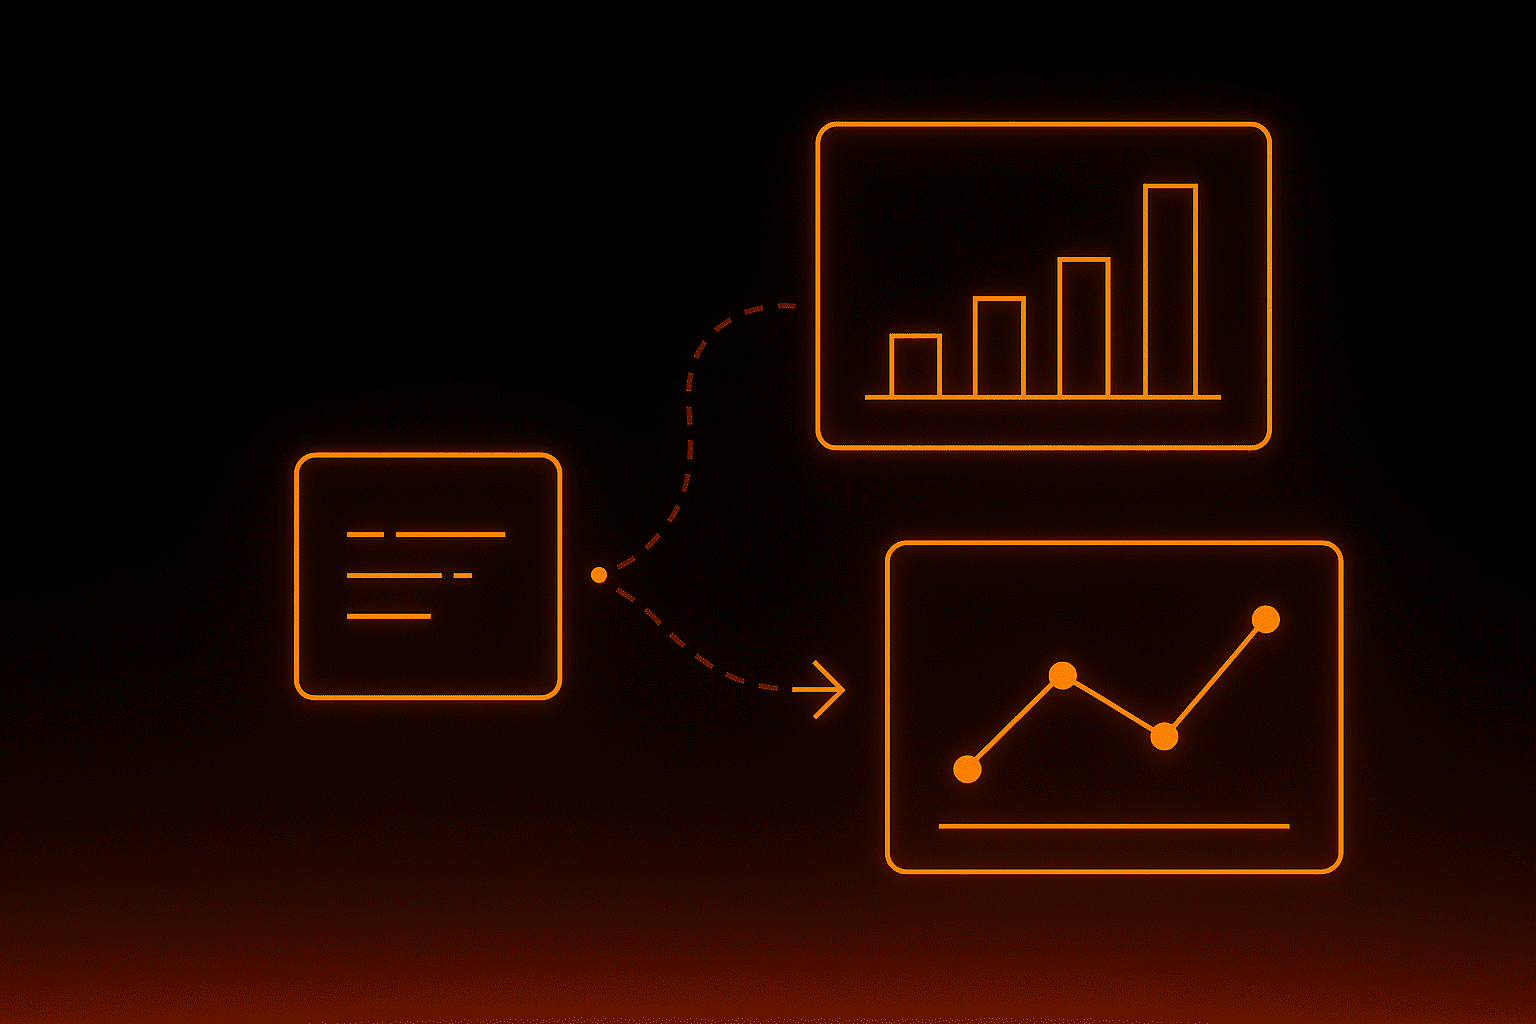
From raw data to reliable visuals
Generate, govern, and maintain visuals from live data
1
Ingest structured and unstructured data
2
Interpret measures, dimensions, and dependencies contextually.
3
Generate appropriate visual formats
4
Apply consistency and governance rules
5
Refresh outputs automatically as data evolves.
Visualization Agents at a Glance
Built for real-world analytical environments
- Consistent metrics across teams and reports
- Support large datasets and high query volumes
- Integrate with existing analytics workflows
- Traceability from visual elements back to source data
- Operate across cloud, warehouse, and environments
Help Center
FAQs
Quick answers to questions you may have. Can't find what you're looking for? Check out our full documentation.
Yes. VapusData Visualization Agents automatically transform raw, structured, or semi-structured data into charts, dashboards, and visual reports without manual modeling or scripting.
Yes. The agents connect to live data sources and continuously refresh visualizations as data updates, ensuring decisions are always based on the latest information.
Yes. Users can generate visualizations using simple natural-language prompts, without SQL, BI expertise, or manual dashboard configuration.
Visualization Agents operate on governed data models with built-in validation, lineage, and access controls, ensuring every chart reflects accurate, approved, and traceable data.
Yes. The agents integrate seamlessly with warehouses, databases, cloud platforms, and enterprise tools, unifying data across systems into a single visualization layer.
Tired of rebuilding charts every time data changes?
Let Vapusdata's Visualization Agents generate and update visuals automatically.